
Serverless platforms make it incredibly easy to deploy applications. You can take raw code, push it up to a service like AWS Lambda, and have a running application in just a few seconds. The serverless platform provider assumes responsibility for hosting and operating the platform, freeing you up to focus on your application.
Naturally, this raises a question: if something goes wrong, who’s responsible?
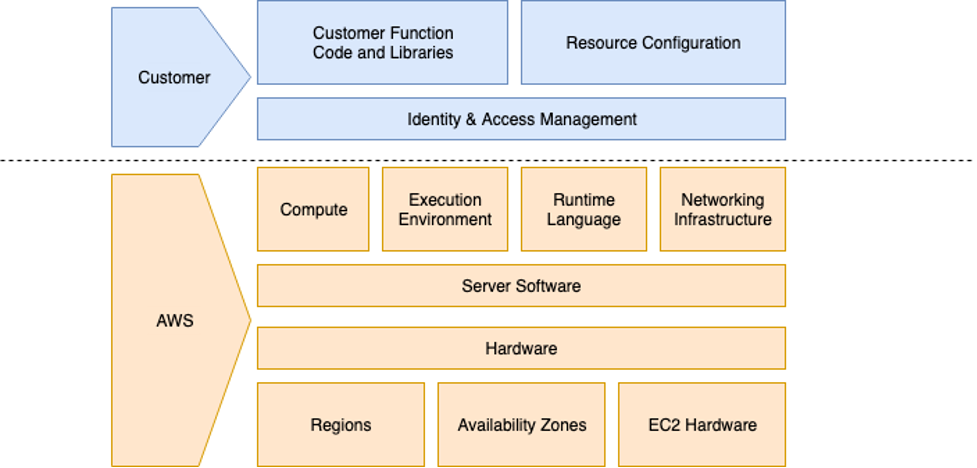
The answer is, unfortunately, nuanced. While it’s the provider’s job to keep the platform running, it’s your job to manage the reliability of your application code and configuration. Another way to phrase this is that cloud providers are responsible for the reliability of the cloud, while customers like you are responsible for reliability in the cloud.
As a serverless developer, some of the questions you should consider are:
- How well does your application perform with limited CPU or RAM?
- How quickly and efficiently can you scale? How long does it take to spin up new instances, and can you handle the load in the meantime?
- Do you have redundant instances running? Are you load-balancing traffic between them? If one fails, does traffic automatically reroute to the remaining one(s)?
- How does your application handle losing connections to dependencies? For example, do your user-facing services still respond to user requests even if your backend is down?
- What happens when your primary DNS instance goes down? Can you fall back to a secondary one?
Most importantly, what’s the user experience like? Before we can answer these questions, we need a way to test our application to understand its behavior under these conditions.
How to test serverless reliability using Failure Flags
Fault injection is a method of testing a system’s resilience by creating controlled failures. Most fault injection tools require an agent running on a host, but the design of serverless platforms makes this approach impossible. Gremlin Failure Flags is a code-level fault injection solution that injects faults directly into your applications.
The way it works is simple: first, you use one of our Failure Flags SDKs to add flags to your code. These flags are modeled after feature flags, but instead of enabling or disabling features, they act as fault injection points. You deploy your application with a Failure Flags sidecar container (or Lambda layer). Lastly, when you run a Failure Flags experiment via the Gremlin web app or API, Gremlin sends the experiment to the sidecar container, and the sidecar injects the fault(s) into the application.
Example: adding a Failure Flag to a Node.js application
To demonstrate Failure Flags, let’s look at a simple Node.js application that stores a list of to-do items (based on this application created by Docker). This application has a simple web interface for entering, checking, and deleting to-do items, which it stores in a SQLite database.
One of the functions this application handles is querying a database for all to-do items. Here’s the code that handles that function:
Database connections can fail for several reasons, such as poor network connectivity, expired credentials, expired TLS certificates, etc. We can make assumptions about how our code will handle a failed connection, but we won’t know until we test it.
Before we can answer this question, we need to add a Failure Flag. Using the Node.js SDK, we can add a new Failure Flag and give it a name, such as db_getItems. Failure Flags lets you pass custom metadata from your application to Gremlin for more advanced targeting. For instance, if this function allowed us to look up a specific entry by ID, we could pass that ID to the Failure Flag and run an experiment that only impacts database calls using that ID. But because this is a general function that returns all items, we’ll ignore labels:
Now, we can run experiments on the db_getItems Failure Flag.
Test 1: Handling database latency
Before we try a complete database failure, let’s look at a degraded network connection. Latency can be a common experience in distributed systems, especially when sending traffic across regions or between clouds. Even a 100-millisecond delay can make a noticeable difference in responsiveness, depending on the number of queries your application makes.
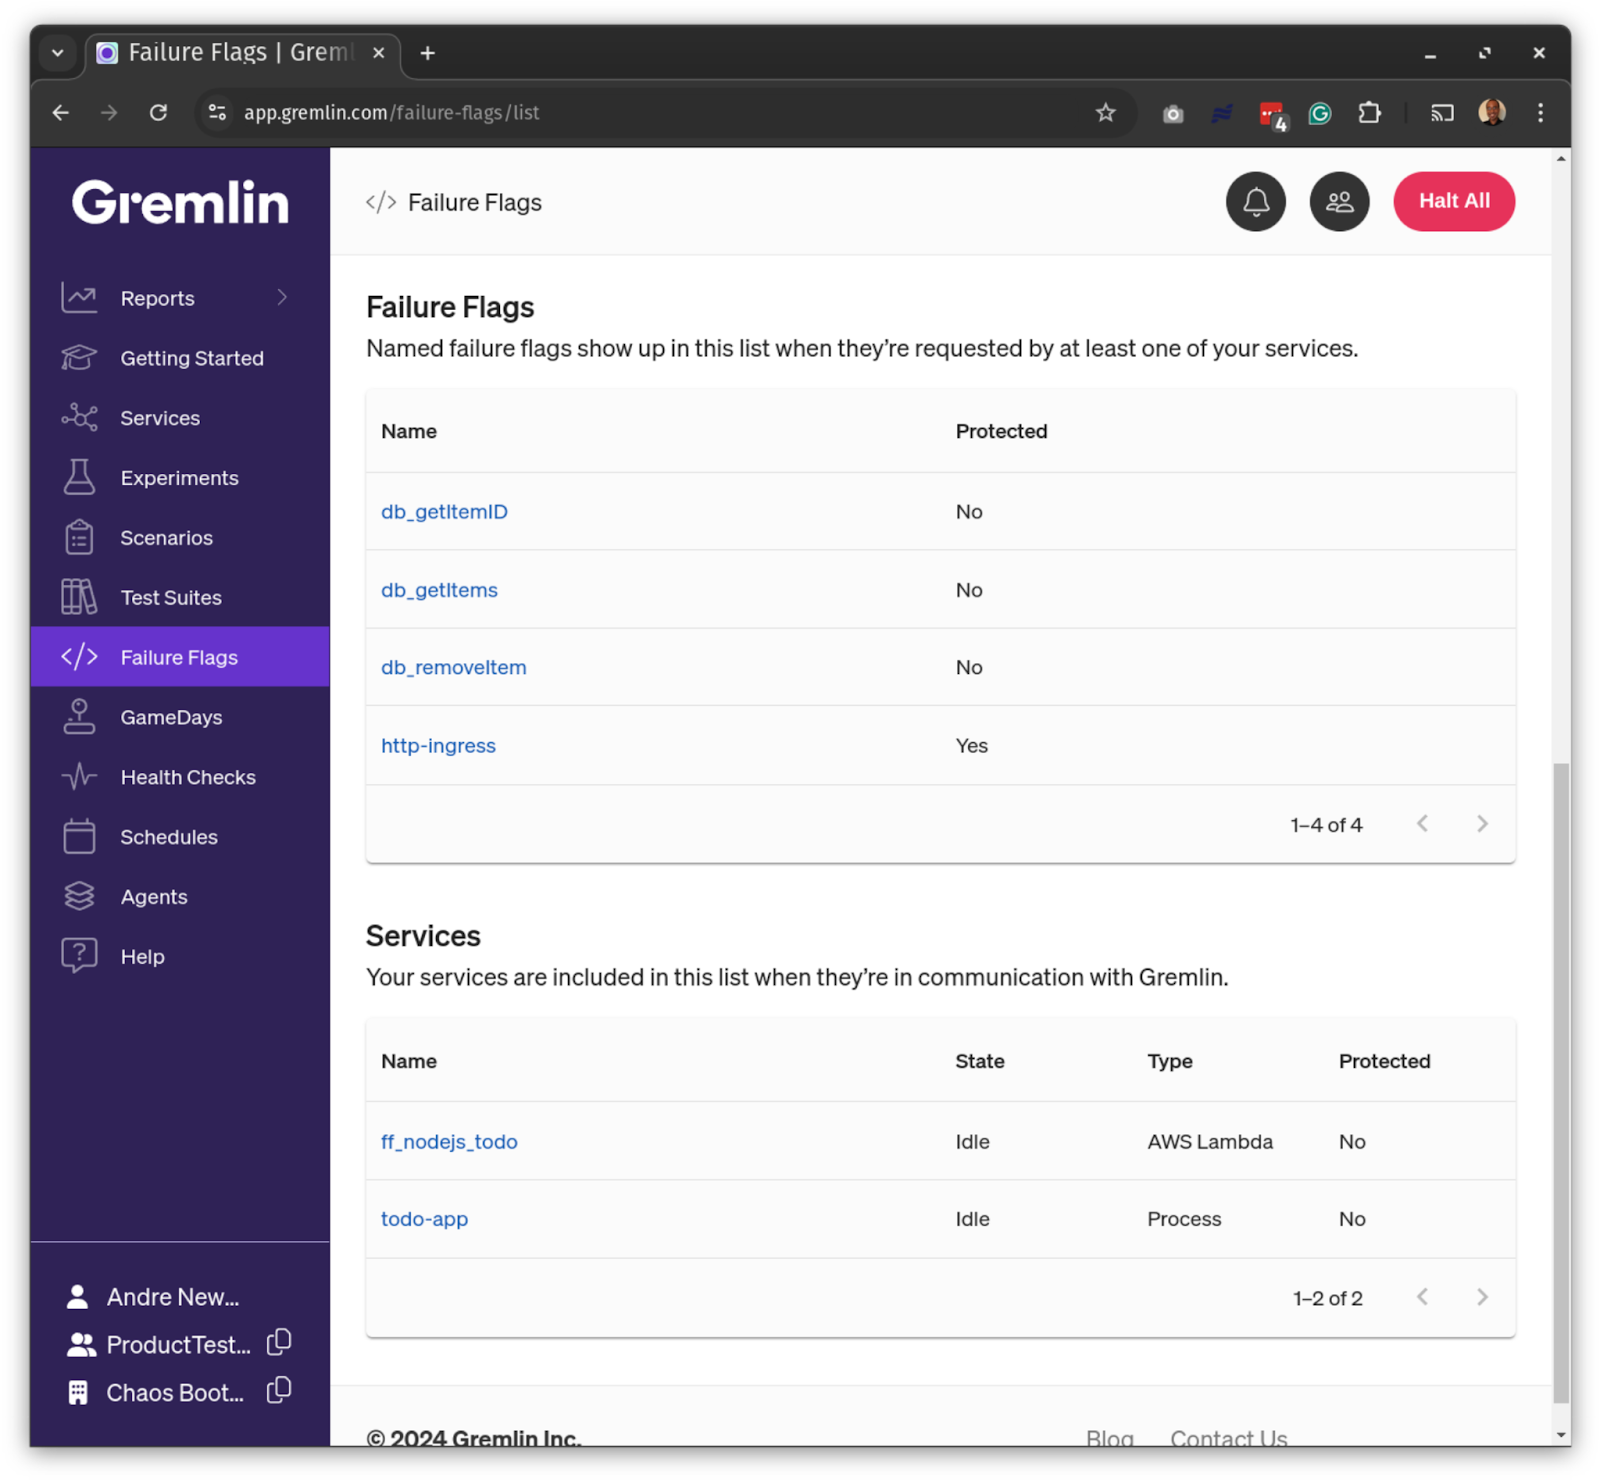
We’ll use the db_getItems Failure Flag we just created. Once we deploy our Lambda function and send at least one request to it, we’ll see both the Lambda function (ff_nodejs_todo) and the flag in the Gremlin web app:
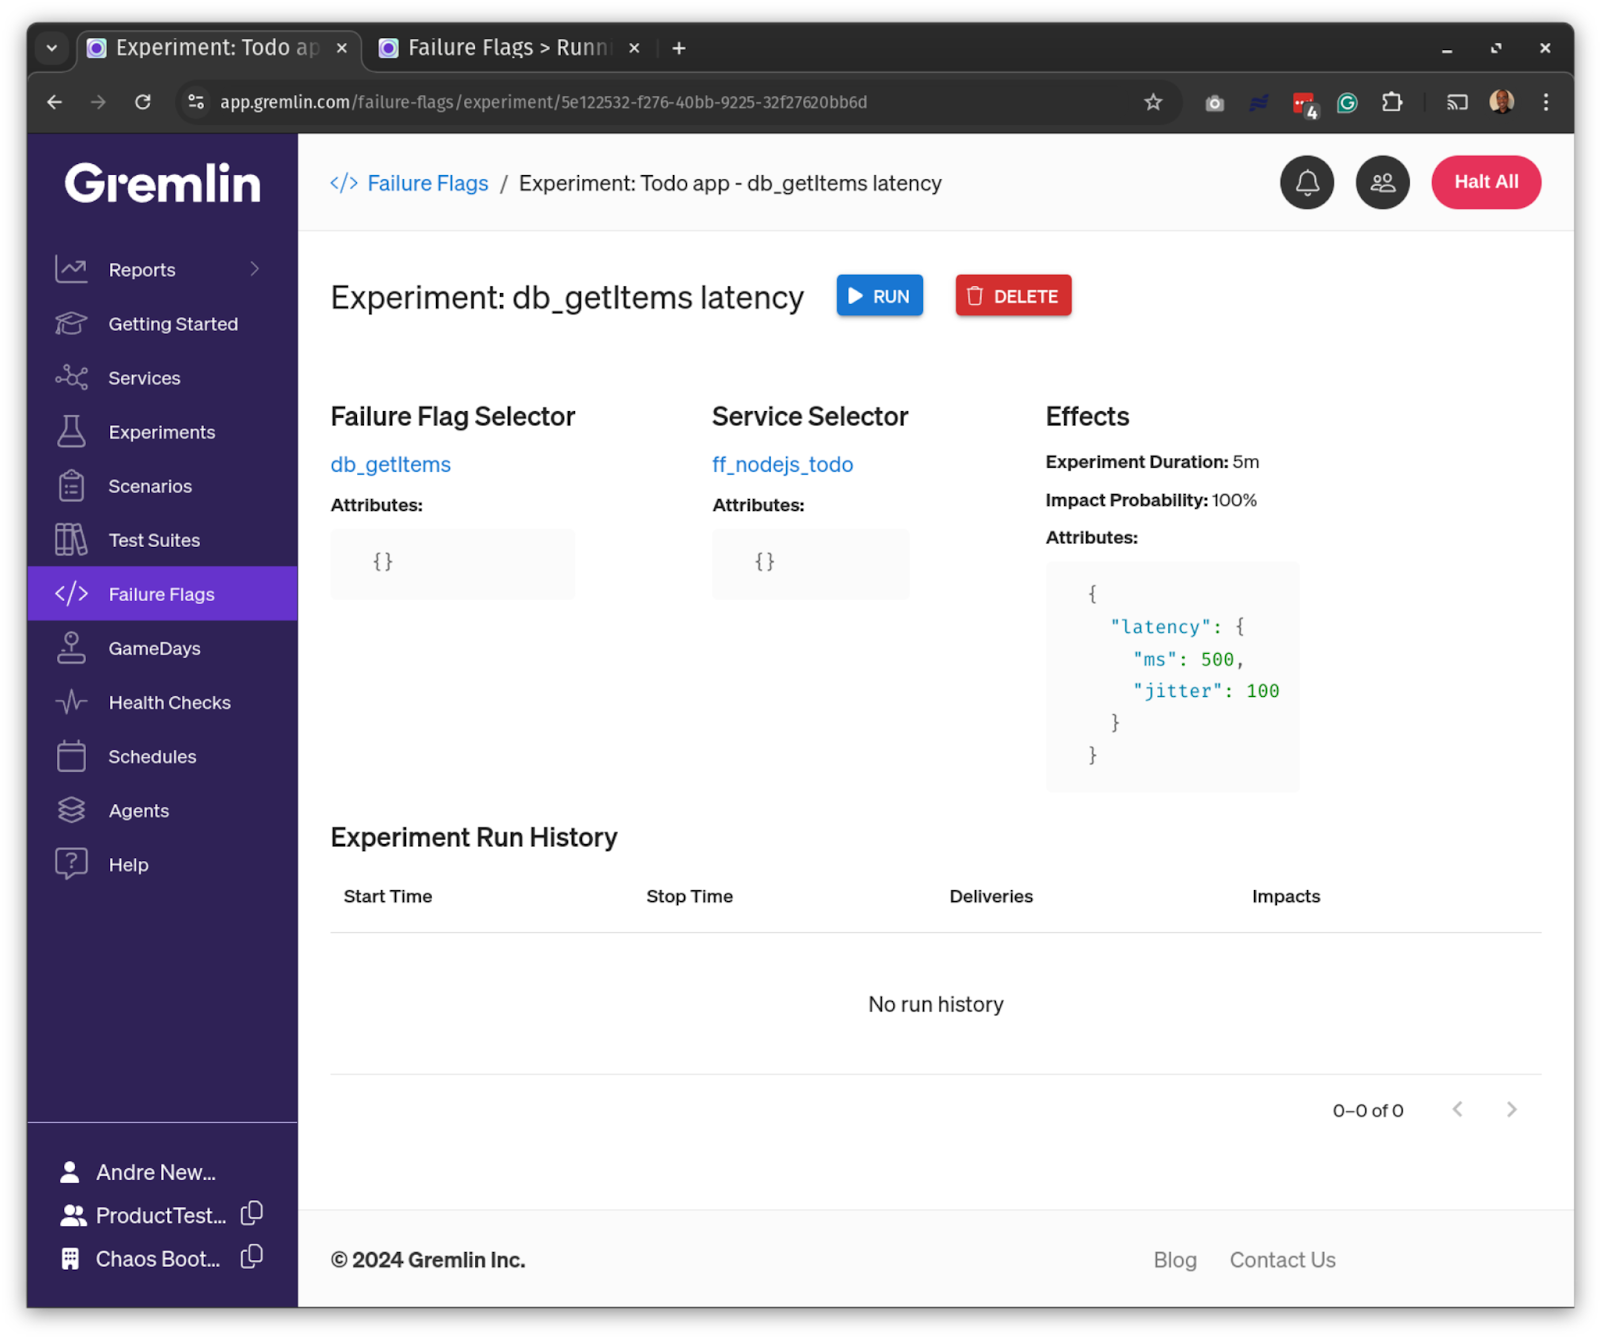
We’ll configure our experiment to add 500ms of latency with 100ms of jitter. This means each request will have between 500–600 ms of latency. Because there might be multiple instances of our application running concurrently, Gremlin lets us choose the percentage of instances to impact. We’ll impact all instances by choosing 100% and run the experiment for 1 minute.
After we start the experiment, we can test our Lambda function by refreshing the page. The result is what we expect: it takes slightly longer for the page to load. This test also reveals a “Loading…” screen, which indicates to users that the application is processing their request.
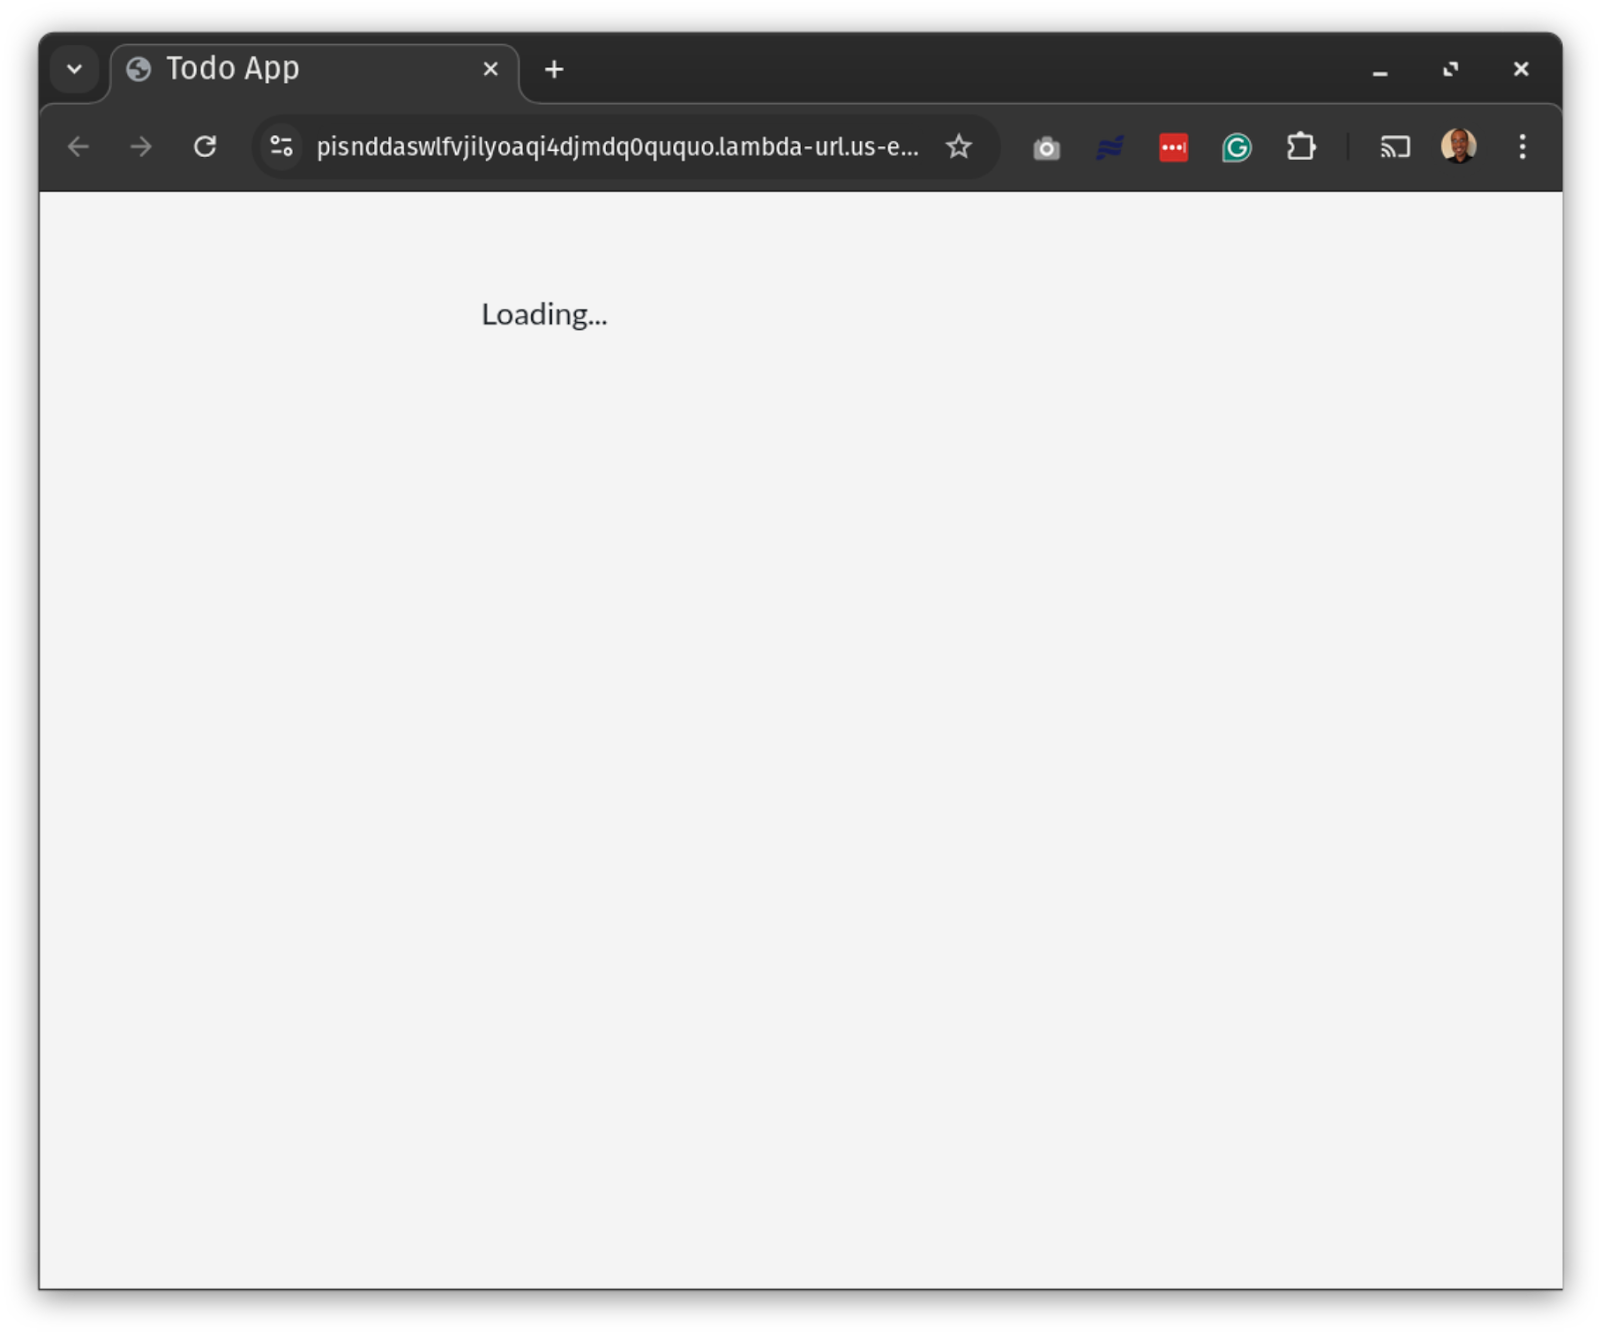
While this is a basic example, visual feedback like this helps users by showing them their request was received, even if it’s taking longer than expected to generate a response. Users might get frustrated or think something went wrong if the screen stayed blank. We could improve this by animating the text, adding a progress spinner, or loading all other assets and only showing “Loading…” instead of the list.
You can also adapt this test for more advanced use cases, like checking database timeouts.
Test 2: Handling dependency failures
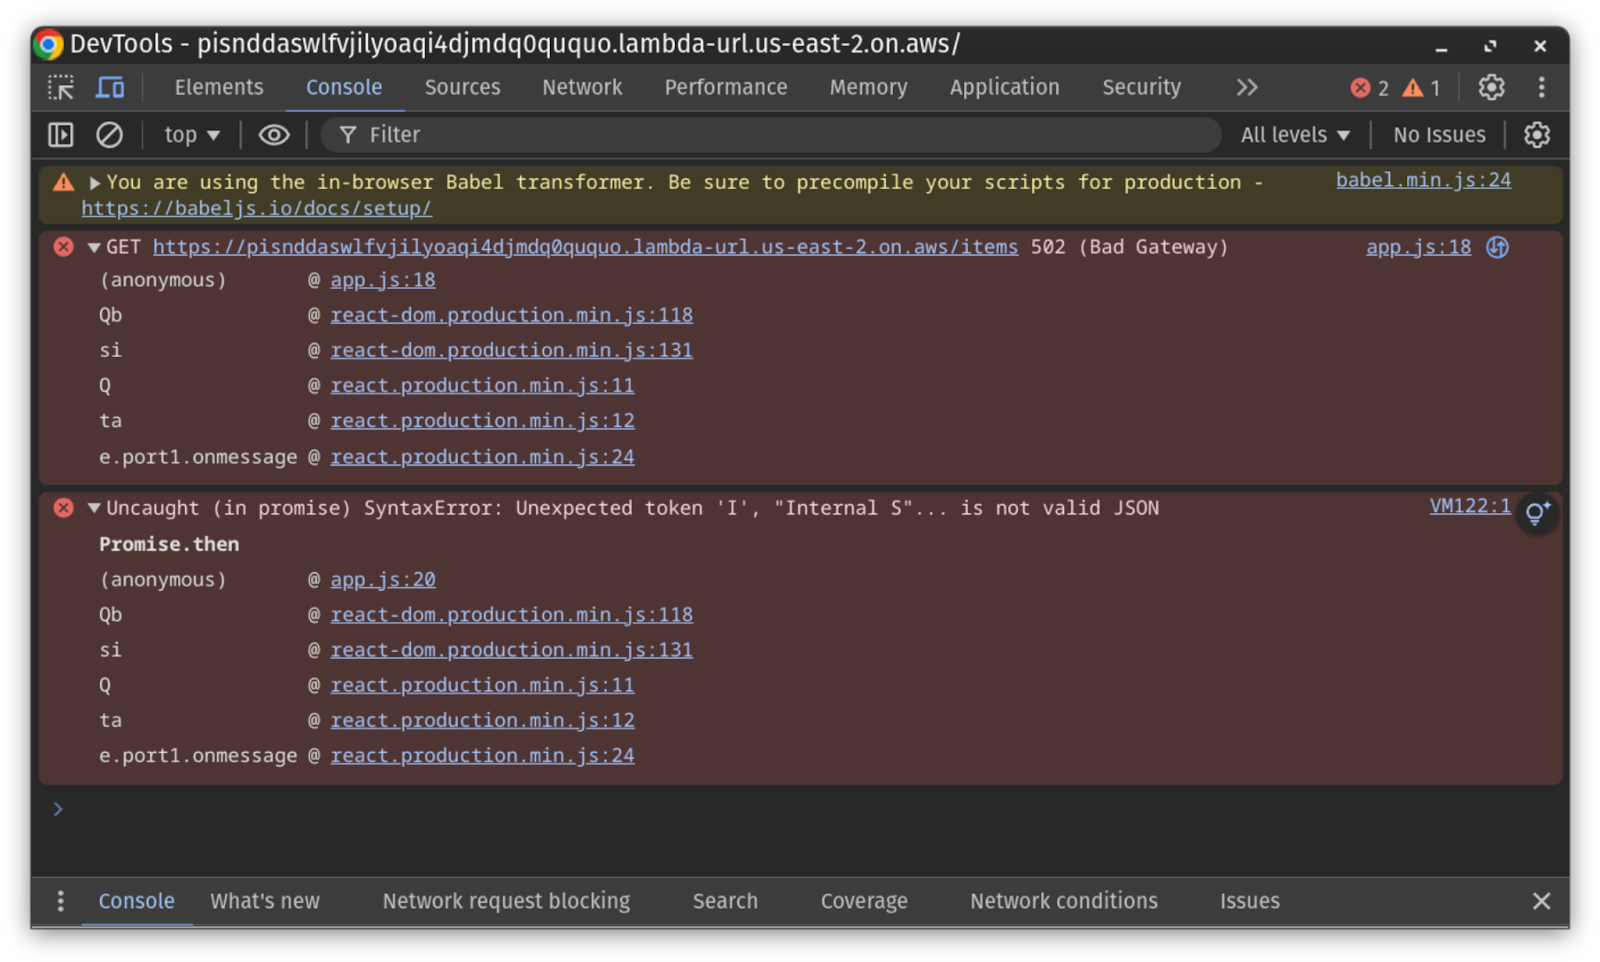
Let’s ask what happens to our application when the database is unavailable. One fault we can cause with Failure Flags is errors and exceptions. We’ll use this to throw a custom exception and observe how our application handles it. Ideally, we’d have an exception handling block to catch issues like these, but what does the UI show?
We’ll create a new Failure Flags experiment in Gremlin and select the db_getItems flag again. We’ll select “exception” as the Effect and add a custom message: “Could not connect to database.” When we run the experiment and refresh our application’s web page, we again see the “Loading…” page, only this time, it doesn’t update, not even after the experiment ends. The only way to know if a failure happened is by checking the JavaScript console using DevTools or the function’s logs in CloudWatch, which is far from an ideal customer experience.
One step to mitigate this is to add exception handlers to our database functions. This will at least provide an escape route for the application if something happens to our database connection in production. Otherwise, users will get frustrated and most likely abandon the page.
Test 3: Analyzing cold start performance
Serverless applications are unique in that they only provision instances as needed. This makes them highly resource-efficient, but it can also lead to cold starts when a serverless function receives a request but doesn’t have any instances available to process it. The serverless platform must hold the request while it spins up an instance of the function, which can take up to several seconds depending on the function's size and the platform's speed.
Most serverless platforms will keep functions running—or at least pause them—for a time in case other requests come in. The platform will send these requests to existing instances before provisioning new ones. AWS Lambda retains these instances for a “non-deterministic period of time…based upon invocation patterns” and “typically occur in under 1% of invocations.” While it’s not likely that your production applications will run into too many cold starts, it’s still good to know how they could impact the user experience.
To test this, we’ll create a new Failure Flag at the start of our function. We’ll call it app_init and put it right after our variable declarations:
According to Lambda, “the duration of a cold start varies from under 100 ms to over 1 second.” To recreate this, we’ll add a small amount of initial latency (100ms) and a significant amount of jitter (2,000ms). We’ll call this experiment “app_init cold start,” and we’ll use Apache Bench to send requests to the function for 30 seconds.
As a baseline, we can complete about 144 requests, which gives us an average of 208 ms per request (30 seconds / 144 requests). While running the experiment, we get an average of 1.1 seconds per request (27 requests over 30 seconds), which is over five times as long. This is an extreme example since serverless platforms like Lambda minimize cold starts by reusing existing instances. However, it shows the impact cold starts can have on serverless applications. For your applications, consider running experiments and slowly adding small amounts of latency (~100ms) to find the point where latency significantly impacts the user experience.
How to adapt Failure Flags to your applications
Hopefully this blog has given you some ideas on where you can use Failure Flags in your applications. Remember that you can add Failure Flags anywhere in your code: before dependency calls, during initialization processes, and even in the middle of complex functions.
If you want a hands-on look at Failure Flags, check out our interactive product tour. For more examples of how to use Failure Flags—or if you use a programming language other than Node.js—check out our tutorial series on running experiments in AWS Lambda.
Gremlin's automated reliability platform empowers you to find and fix availability risks before they impact your users. Start finding hidden risks in your systems with a free 30 day trial.
sTART YOUR TRIAL
What is Failure Flags? Build testable, reliable software—without touching infrastructure
Building provably reliable systems means building testable systems. Testing for failure conditions is the only way to...


Building provably reliable systems means building testable systems. Testing for failure conditions is the only way to...
Read more